
Atrial fibrillation
Anush Devadhasan UCD School of Medicine and Medical Science, University College Dublin, Belfield, Dublin 4, Ireland
ABSTRACT
Atrial fibrillation (AF) is a cardiac disorder characterised by a rapid, irregular heartbeat. Onset often comprises no symptoms, making AF difficult to diagnose [1]. If left untreated, AF poses potential risks of blood clot formation, leading to ischaemic stroke [1]. However, two atrial fibrillation conditions exist: terminating and non-terminating. The terminating condition spontaneously ceases whereas the non-terminating condition requires medical intervention. Furthermore, rural/impoverished regions are at heightened risks due to lack of healthcare facilities and clinicians. High AF prevalence rates put millions at risk of this cardiac disorder globally [1].
This study proposes a Support Vector Machine-enabled Electrocardiogram device for algorithmic diagnosis of healthy, terminating AF, and non-terminating AF conditions. The signal was acquired from a differential amplifier; integrating low-pass, high-pass, and bandstop filters for electrical interference reduction [2]. The class determination algorithm, through autonomous extraction of instantaneous amplitude, zero crossing rate, and power spectral density for application to SVM classification in dimensionally reduced feature space, detected cardiac arrhythmias in ECG signals [3]. The SVM learning model detected unknown signal classes though training with data comprising extracted, labelled ECG signal features. Corresponding diagnoses were displayed via LED indicators. The objective was to develop a feasible system for AF diagnoses through interfacing of the amplifier with the SVM algorithm.
ECG signal QRS-complex features were adequately captured through the amplification system. Algorithmic SVM classification yielded sensitivities of 80.00-83.33% to signal class. Therefore, significant progress has been achieved and, with further development, may be ready for deployment to appropriate regions.
Article
Introduction
Atrial fibrillation
Atrial fibrillation is a rapid and irregular heartbeat induced by electrical disturbances in the sinoatrial node. It is categorised into three classes: paroxysmal, persistent, and permanent. Paroxysmal AF is characterised by self-terminating episodes whereas persistent and permanent conditions are non-terminating and require medical intervention to prevent complications.
Atrial fibrillation occurs with minimal symptomatology and high prevalence rates, thereby presenting risks of complications, arising from non-terminating AF, to many people. Furthermore, rural regions lack the necessary medical instruments, which can be costly, and skilled cardiologists, trained to identify minute variations in ECG tracings, for AF diagnoses. This presents the need for an affordable device, integrating an ECG device with the diagnostic abilities of a cardiologist through signal processing and algorithmic classification, for AF detection/classification.
AF Diagnostic Device
This study proposes a Support Vector Machine-enabled Electrocardiogram device for algorithmic determination of ECG signal class: healthy, terminating AF, or non-terminating AF. The signal will be acquired from a differential amplifier; integrating low-pass, high-pass, and bandstop filters for reduction of various electrical interferences [2]. The class determination algorithm will, through autonomous extraction of instantaneous amplitude, zero crossing rate, and power spectral density for application to SVM classification in dimensionally reduced feature space, detect cardiac arrhythmias in ECG signals3. The SVM learning model will detect unknown signal classes though training with data comprising extracted ECG signal features labelled with one class, projected onto a 3,840 dimensional feature space, then dimensionally reduced by principal component analysis. A 70%-80% sensitivity to classes is hypothesised.

Figure 1: Flowchart for Proposed Device Design
Rationale
Chugh et al., in 2010, estimated that 33.5 million individuals suffered from atrial fibrillation worldwide. This study found a general increase in AF-associated mortality over time and concluded "systematic, global surveillance of AF is required to better direct prevention and treatment strategies". The proposed device would assist in achieving such systematic and global surveillance of AF, particularly in rural and poverty-stricken areas.
ECG Device
Prior studies have attempted to develop low-cost electrocardiogram devices for deployment in resource-limited areas. The Biosignal Pi, developed by Abtahi et al. (2015), is an affordable biosignal measurement platform capable of obtaining various readings, including ECG tracings. However, this device is rendered ineffective without medical specialists for the analysis of biodata and resulting diagnosis. The proposed device integrates a classifier algorithm with an affordable ECG device to overcome absence of medical specialists.
SVM Classifier
The classifier algorithm utilises Support Vector Machine for ECG signal class detection. The SVM algorithm initially determines "support vectors" for two separate classes of training data, then calculates a maximum-margin separating hyperplane in the n-dimensional feature space [4]. When provided a data set of an unlabelled class (in this case the ECG signal obtained from the patient), SVM determines its position with respect to the hyperplane; the side of the hyperplane to which the data set lies [4]. This determines the predicted class (diagnoses) of the ECG signal by SVM [4]. The proposed device detects three different classes, and thereby, training data belonging to each of these classes are required. Healthy, terminating AF, and non-terminating AF ECG tracing files were obtained from the Physionet database and extracted features were used to train the SVM learning model [5].
Feature Extraction
The extracted features for training were instantaneous amplitude, zero crossing rate of instantaneous phase, and power spectral density [3]. For R-peak analysis, an analytic signal was derived from each ECG tracing through Hilbert transform; from which instantaneous amplitude was obtained [6]. Derived instantaneous phase from the Hilbert transform of the signal allowed determination of the zero crossing rate. Mohebbi et al. (2014) demonstrated that power spectral density is an effective feature descriptor for training of AF termination prediction learning models. This algorithm extracts power spectral density from raw ECG signals. PCA is carried out for dimensionality reduction. The developed algorithm was implemented in python using the Numpy, Scipy, Sci-Kit Learn, and Matplotlib modules.

Figure 2: Flowchart of Classification Algorithm
Signal Processing
ECG recordings must be processed for electrical noise reduction and baseline wandering elimination. Noises arising from power line interference will be filtered out by a bandstop filter attenuating frequencies around 60Hz and myogenic activity by a 7Hz high pass filter [6]. Baseline wandering elimination will be done through a 6th order high pass Butterworth filter [6] implemented in the SVM algorithm.
materials and Methods
A. ECG Device Construction
Differential Amplifier

Equation 1

Figure 3: Schematic of Differential Amplifier
For ECG signal measurement, an AD620AN instrumentation amplifier was used to measure potential difference across the chest. Amp gain is given by Equation 1, where R is resistance and G is gain. A 560 ohm resistor was set, equating to a 89.21 gain.
Two 9v batteries are used to set +9v, 0v, and -9v. Pins 2 and 3 connect to copper penny electrodes. The signal is output by pin 6.
60Hz Band-Stop Filter

Equation 2
Frequencies at 60Hz were attenuated by a notch filter, a type of band-stop filter, due to power line interference. Low and high pass components connected in parallel collectively filter frequencies at 60Hz. The filter is constructed using an operational amplifier for introduction of a gain. Resistance and capacitance values are determined by equation 2, where the filtered frequency band is given by the variable fr, C is the capacitance of capacitors 1 and 2, and R is the resistance of resistors 0 and 1 [7]
At a notch frequency of 60Hz, C1 and C2 equate to 270pF and R0 and R1 equate to 10MΩ. C0 is twice C1 and C2, 540pF. R2 is half R0 and R1, 5MΩ. R3 and R4 are 10MΩ..

Figure 4: Schematic of Notch Filter
7 Hz High Pass Filter
The gain of frequencies below 7Hz was dampened by a High Pass Filter for elimination of interference from Galvanic Skin Response. This circuit has a second order design, consisting of two connected high pass filters. The cutoff frequency, fc, is given by equation 3 [8].

Equation 3
Setting R1 to 47 kΩ, R2 to 220 kΩ, and C1 and C2 to 220 nF yields a cutoff frequency of 7.11 Hz.

Figure 5: Schematic of 7 Hz High Pass Filter
31 Hz Low Pass Filter
The gain of frequencies greater than 31 Hz were dampened by a Low Pass Filter due to the insignificance of data above this frequency cutoff; the acquired ECG signal will not exceed a frequency 31 Hz. The cutoff frequency, fc, as for the High Pass Filter, is given by equation 3 [8]. Setting C1 to 100 nF, C2 to 25nF, and R1 and R2 to 100 kΩ yields a cutoff frequency of 31.83 Hz.

Figure 6: Schematic of 31 Hz Low Pass Filter
Reading the Analog Signal
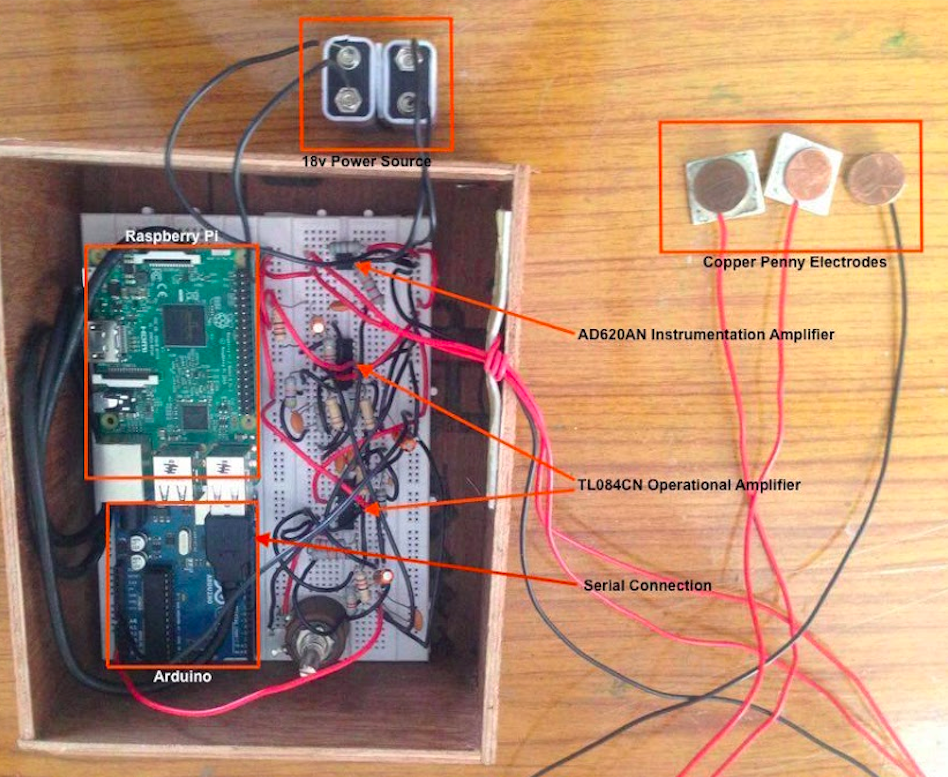
Figure 7: Hardware of Developed Device
The processed analog signal is subsequently input to an Arduino though the A0 (analog) port. A burnt analog read program on the Arduino, through a serial connection, sends the signal data to a Raspberry Pi running the classifier algorithm (using the Serial module) for backend processing.
Front End
A pushbutton initiates patient ECG signal recording/storage in the Arduino. Following class detection, the determined class is relayed to the Arduino via serial communication. Subsequently, one of three indicator LEDs (for each class) are lit for display of diagnosis.
B. SVM Classifier Development
Two classification algorithms are required for this device: 1) for differentiation between healthy and AF conditions and, 2) between terminating AF and non-terminating AF. Regardless, both are constructed similarly. The algorithm is executed in accordance with Fig.2.
Baseline Wandering Elimination
The Scipy Python module is used for construction and implementation of a 6th order high-pass butterworth filter for BW elimination.
Feature Extraction
Hilbert transform allows analytic signal derivation, a complex-valued function comprising no negative frequency components, for R-peaks analysis. The analytic signal is obtained using the Scipy module. Signal features used by the algorithm include instantaneous amplitude and zero crossing rate, both computed using the Scipy module. Scipy is also used for extraction of the signal power spectral density.

Figure 8: Signal Processing of Sample Signal
SVM Training/Implementation
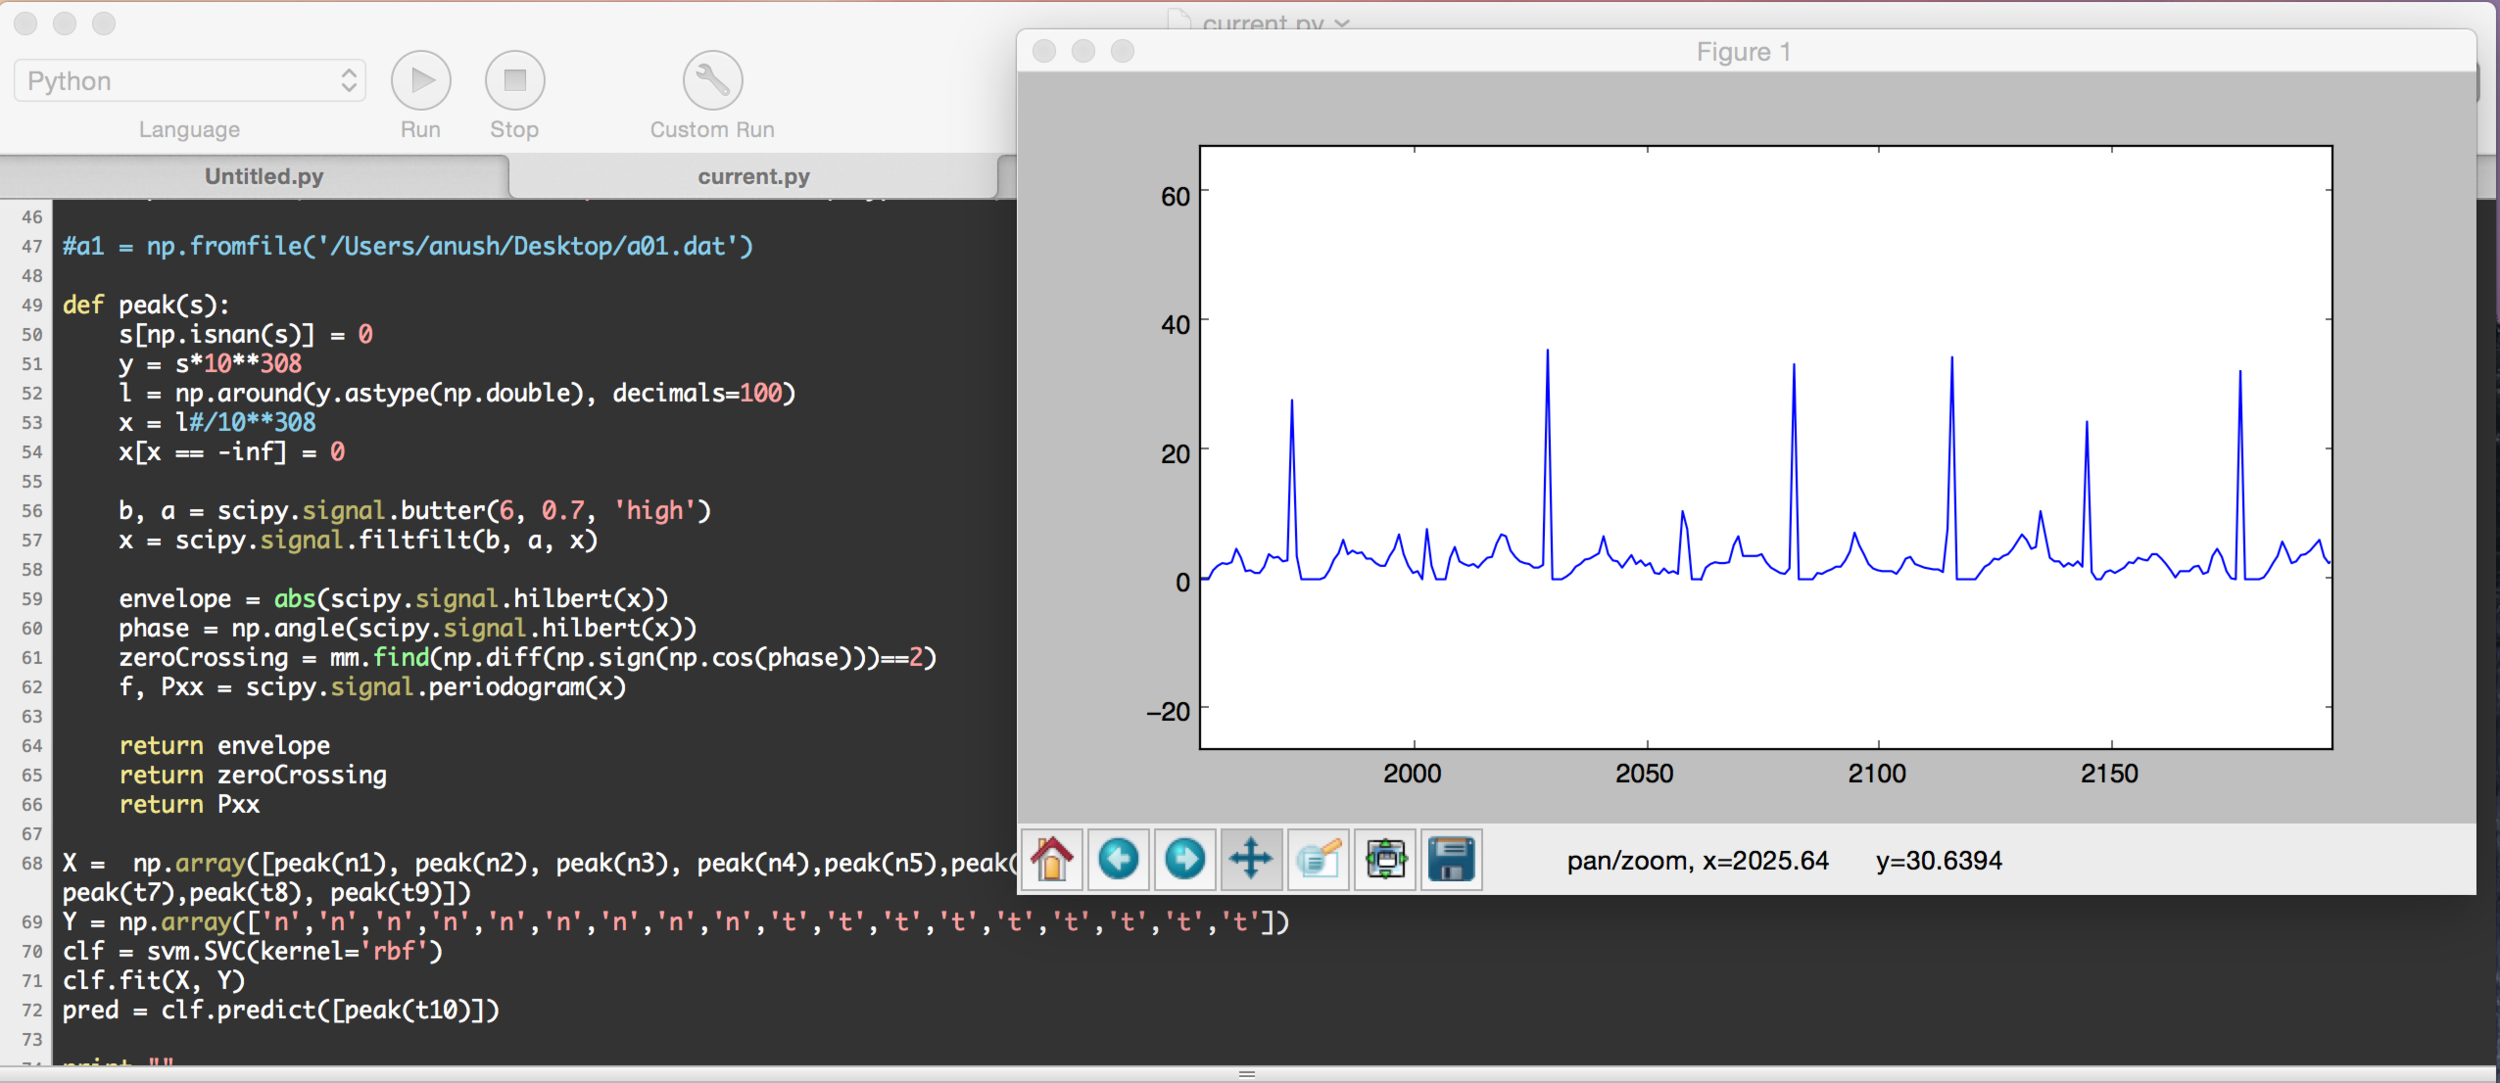
Figure 9: Sample Code from the Classifier Algorithm
The Sci-Kit Learn module was used for SVM implementation. ECG signals with labelled diagnoses were obtained from Physionet's AF Termination Database for training [5]. Then an SVM Learning Model with a Radial Basis Function kernel is generated. The training data is fit to the Learning Model for prediction of a label (diagnosis) for an unlabelled signal represented in dimensionally reduced feature space.
Results
Testing of the developed device consisted of two stages: determining quality of the captured ECG signal through identification of the QRS complex of a normal sinus rhythm and cross-validation of the ECG signal class determination algorithm against pre-diagnosed tracings. Due to inaccessibility to atrial fibrillation patients, the device could not be tested on humans for a measure of conjoined functionality of the ECG device with the classification algorithm.
A. ECG Device Capture Quality Evaluation
A normal sinus rhythm was recorded by the developed ECG device for identification of the QRS complex and evaluation of capture quality.
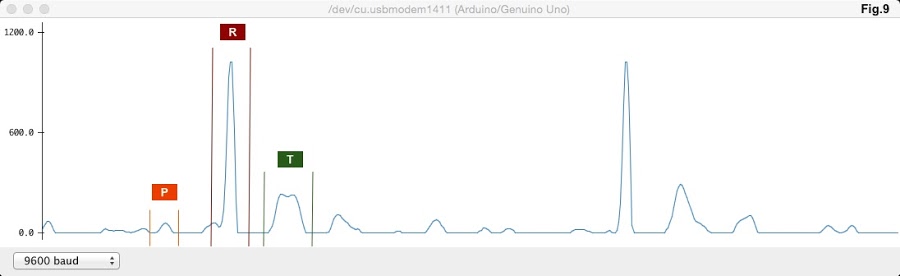
Figure 10: Acquired ECG Tracing from the Developed Device
The acquired ECG tracing from the ECG device exhibited prominent features of a QRS complex. Right and left atrial depolarisation is represented by the P peak. Right and left ventricular depolarisation is represented by the R peak, which is preceded by the Atrioventricular node conduction delay. The final T peak is representative of ventricular re-polarisation. Therefore, characteristic features of a normal sinus rhythm have been sufficiently captured.
B. SVM Classification Algorithm Cross-Validation

Figure 11: Cross-Validation Procedure
For determination of the SVM classifier's accuracy, algorithmic atrial fibrillation diagnosis of ECG tracings were cross-validated against predetermined signal classes using data obtained from the Physionet online database [5]. This procedure was executed for two different classification algorithms: 1) general AF versus healthy tracing detection (Classifier A) and, 2) terminating AF versus non-termination AF tracing detection (Classifier B).
A set of 60, labelled .dat ECG tracings (evenly distributed among the Terminating AF, Non-Terminating AF, and healthy classes) were acquired from the Physionet database [5]. Half the tracings were used for SVM training and the other half were set aside for cross-validation testing, with tracings equally distributed among classes for both sets. ECG signal sets were algorithmically classified by both SVM programs for acquirement of diagnoses. Evaluation of classification accuracy (percent sensitivity) involved matching predicted diagnoses with corresponding, database-determined labels and subsequent verification of a match. Only the Terminating AF and Non-Terminating AF classes of ECG tracings were used for cross-validation of Classifier B whereas all 30 ECG tracings were used for Classifier A cross-validation.

Table 1: Classifier Accuracy Data
A percent sensitivity of 80% or greater was achieved by both classifiers. Therefore, the SVM classifiers exhibited diagnosing abilities to a considerable degree of accuracy. Furthermore, when trained with smaller subsets of the training data, a decrease in percent sensitivity was observed. This suggests, through data extrapolation, potential increase in percent sensitivity with a larger training data set.
discussion
Limitations
A radial basis function kernel for support vector machine was assumed to yield optimum performance in this study. However, trial and error methods for evaluation of classification accuracy with other kernel functions may reveal a new optimum. Application of alternate classification algorithms, such as block-based neural networks, have also performed with considerable accuracy [9]. Therefore, an investigation into an optimum kernel function may yield greater precent sensitivity to signal class. Furthermore, minor redundant electrical noise was evident in signal recordings by the ECG device. This suggests the need for further signal processing for adequate signal extraction. Previous research has successfully demonstrated effective signal processing methods rooted in wavelet optimisation [10].
Recommendations
As a result of discrepancies in recording quality between commercial ECGs and the developed ECG device, the SVM classifier may exhibit greater accuracy if trained with tracings derived from the developed device itself. Therefore, a database-acquired training data set would be rendered insufficient for accurate diagnoses. Future work requires procurement of ECG tracings by use of the developed ECG device and corresponding labels (diagnoses) through analysis by a certified cardiologist. ECG tracing collection must be distributed equally among the three classes for adequate training data. Future work also includes evaluation of alternate supervised machine learning techniques for increased performance of AF classification and diagnosis. Potential candidates for AF diagnostic abilities testing include Artificial Neural Networks (ANNs) and K-Nearest Neighbours (k-NN) implementations. Furthermore, an unsupervised learning model may be utilised if no trained cardiologist is accessible for labelling of the developed device-acquired training data. Unsupervised learning extracts hidden structures from unlabelled data sets for class allocation.
conclusion
The developed diagnostic device has successfully interfaced an affordable ECG device with a clinician-emulating classification algorithm for portable, accessible and affordable atrial fibrillation detection and classification. Prominent features of associated QRS complexes were evident. Support Vector Machine Classification, executed by the diagnosis algorithm, exhibited percent sensitivities to ECG signal class of 80% - 83.33%. Acquired results have proven the hypothesis partially correct: percentage sensitivity of Classifier B was 80% whereas that of Classifier A exceeded the predicted range (83.33%). Coupled functionality of the aforementioned components could yield a feasible technique for automatic AF diagnoses through algorithmic analysis of patient ECG signals in rural, impoverished regions; particularly those lacking medial specialists.
The lack of symptoms associated with atrial fibrillation onset poses risks including blood clot formation, potentially resulting in ischemic stroke. Residents of rural and impoverished areas experience heightened threats brought about by lack of medical care and specialists for AF diagnosis. The developed device in this study would be a potential contender for rapid and automatic AF diagnosis for undertaking of the clinician's role. Furthermore, affordability and portability ensure the device's potential to be deployed to the lacking regions. Algorithmic signal processing and analysis have replaced the traditional visual-based approach of clinicians. Predicted diagnosis would subsequently be indicative of necessary action for AF treatment. Total costs incurred for development of the device accounted to about $60. However, commercialisation may further reduce costs.
ACKNOWLEDGEMENTS
I would like to extend my gratitude to the guidance and support I received from my research mentor, Dr. Prem Thankappan, throughout this research project. I furthermore wish to thank University College Dublin for the academic resources that were made available to me, and the UCD Student Medical Journal for this opportunity for publication of my research.
References
nhlbi.nih.gov [Internet]. National Institutes of Health; 2014[updated 2016 September 18; cited 2017 February 27]. Available from: https://www.nhlbi.nih.gov/health/health-topics/topics/af
egr.msu.edu [Internet]. Springer Reference; 2013[updated 2013 May 4; cited 2017 February 27]. Available from: http://www.egr.msu.edu/classes/ece480/capstone/spring13/group03/documents/ElectrocardiographyCircuitDesign.pdf
Rodriguez R. Mexicano J. Bila S. Feature extraction of electrocardiogram signals by applying adaptive thresholding and principal component analysis. J. Applied Research and Technology [Internet]. 2015
ocw.mit.edu [Internet]. Mit open courseware; 2010[updated 2010 January 10; cited 2017 February 27]. Available from: https://ocw.mit.edu/courses/electrical-engineering-and-computer-science/6-034-artificial-intelligence-fall-2010/lecture-videos/lecture-16-learning-support-vector-machines/
physionet.org [Internet]. Physionet; 2012[updated 2012 January 5; cited 2017 February 27]. Available from: https://www.physionet.org/challenge/2004/
ni.com [Internet]. National Instruments; 2012[updated 2012 August 16; cited 2017 February 27]. Available from: http://www.ni.com/tutorial/6349/en/
circuitstoday.com [Internet]. CircuitsToday; 2011[updated 2011 April 14; cited 2017 February 27]. Available from: http://www.circuitstoday.com/band-stop-filter
swarthmore.edu [Internet]. Swarthmore College; [cited 2017 February 27]. Available from: http://www.swarthmore.edu/NatSci/echeeve1/Ref/FilterBkgrnd/Filters.html
Seong K. Gregory D. ECG signal classification using block-based neural networks. IEEE [Internet]. 2005
Abdelhamid D. A wavelet optimisation approach for ECG signal classification. Biomedical signal processing and control [Internet]. 2012